

Economic Survey 2025-26
-A PIB FEATURE–
India enters FY26 with strong economic momentum supported by stable macroeconomic fundamentals, sustained policy support, and broad-based sectoral performance. Despite a challenging global environment, the economy has remained resilient, with robust growth, historically low inflation, improving labour market indicators, and strengthening external and financial buffers. Coordinated fiscal, monetary, and structural policies have reinforced macroeconomic stability while supporting investment, consumption, and inclusion.
The emerging macroeconomic environment reflects an economy that is consolidating its gains while strengthening the foundations for sustained and inclusive growth.
State of the Economy
Growth Outlook: GDP and Demand Conditions
India’s growth outlook remains robust, underpinned by strong macroeconomic fundamentals and broad-based demand momentum. As per the First Advance Estimates, real GDP and Gross Value Added (GVA) are projected to grow by 7.4% and 7.3% respectively in FY26.
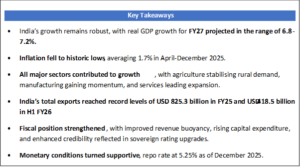
A strong agricultural performance has bolstered rural incomes and consumption, while improvements in urban demand- supported by tax rationalisation measures indicate a broadening of the consumption base. India’s potential growth is estimated at around 7%, with real GDP growth for FY27 projected in the range of 6.8-7.2%, reflecting sustained medium-term growth capacity amid a challenging global environment.
| Inflation Trends and Outlook
India recorded the lowest inflation rate since the beginning of the CPI series, with April-December 2025 average headline inflation coming in at 1.7%, attributing to general disinflationary trend in food and fuel prices. Among major Emerging Markets & Developing Economies (EMDEs), India has recorded one of the sharpest declines in headline inflation in 2025 over 2024, amounting to about 1.8 percentage points. In December 2025, the RBI lowered its inflation forecast for FY26 from 2.6% to 2.0%, supported by a good kharif harvest and healthy rabi sowing. The IMF projects inflation at 2.8% in FY26 and 4.0% in FY27. The RBI’s forecast for headline Inflation for Q1 and Q2 of FY27 currently stands at 3.9 and 4%. Looking ahead, the inflation outlook remains benign, supported by favourable supply side conditions and the gradual pass-through of GST rate rationalisation. |
Sectoral Drivers of Growth
- Agriculture: Stabilising Rural Demand
Agriculture and allied activities continue to play a stabilising role in India’s growth cycle by supporting rural demand and income security. The sector is estimated to grow by 3.1% in FY26, supported by a favourable monsoon during H1 FY26. Agricultural GVA expanded by 3.6% in H1 FY26, higher than the 2.7% growth recorded in H1 FY25, reflecting improved crop performance.
Allied activities particularly livestock and fisheries have exhibited stable growth of around 5–6%, providing resilience and diversification reflecting a relatively stable expansion in allied sectors.
- Industry and Manufacturing: Momentum Builds
Industrial activity is expected to gain momentum in FY26, with the industrial sector projected to grow by 6.2%, up from 5.9% in FY25. The sector recorded growth of 7.0% in the first half of FY26, exceeding the growth of 6.1% in H1 of FY25 and the pre-COVID trend of 5.2%.
Manufacturing has emerged as a key growth engine, with GVA growth accelerating to 7.72% in Q1 and 9.13% in Q2 of FY26, signalling a structural recovery. Government-led initiatives, particularly the Production Linked Incentive (PLI) schemes across 14 sectors, have played a catalytic role attracting over ₹2.0 lakh crore of actual investment, generating incremental production/sales exceeding ₹18.7 lakh crore, and creating over 12.6 lakh jobs as of September 2025.
India’s innovation ecosystem has also strengthened, with the country’s Global Innovation Index rank improving to 38th in 2025, up from 66th in 2019, reinforcing the role of manufacturing-led innovation in long-term growth.
- Services: The Dominant Growth Engine
Services sector is estimated to have grown by 9.1% in FY26, up from 7.2% in FY25, indicating a further acceleration in services-led expansion. Services’ share in GDP rose to 53.6% in H1 FY26, while its share in GVA reached a historic high of 56.4% as per the FY26 First Advance Estimates, reflecting the rising importance of modern, tradable, and digitally delivered services.
India is now the world’s seventh-largest exporter of services, with its share in global services trade more than doubling from 2% in 2005 to 4.3% in 2024. And the sector remains the largest recipient of foreign direct investment. Implicit estimate for H2 suggests a continuation of the services sector’s momentum, supported by resilient domestic demand and steady export activity.
Employment and Labour Market Trends
India’s labour market continues to demonstrate resilience alongside economic expansion. In Q2 (July to September 2025) FY26, total employment stood at 56.2 crore persons (aged 15 years and above), reflecting the creation of approximately 8.7 lakh new jobs compared to Q1(April to June 2025) FY26.
According to the Periodic Labour Force Survey (PLFS), key labour indicators point to strengthening employment conditions.
- The Labour Force Participation Rate (LFPR) for persons aged 15 years and above increased to 56.1% in December 2025.
- Female LFPR rose to 35.3%, indicating rising participation and improving inclusion.
- The Worker Population Ratio (WPR) increased to 53.4%, reflecting steady employment absorption.
- The unemployment rate declined to 4.8% in December 2025, continuing its downward trajectory.
The Annual Survey of Industries (ASI) FY24 highlights the strength of organised manufacturing, with employment rising by 6% year-on-year, translating into an addition of over 10 lakh jobs compared to FY23.
As of January 2026, the e-Shram portal has registered over 31 crore unorganised workers, with women accounting for more than 54% of total registrants significantly strengthening the outreach of gender-focused welfare initiatives. The National Career Service (NCS) platform has emerged as a key labour market intermediary, with over 5.9 crore registered job seekers and 53 lakh job providers, and mobilisation of approximately 8 crore vacancies across sectors. It recorded over a 200% increase in job vacancies in FY24 compared to FY23.
Trade Performance: Export Diversification and Services Strength
On the trade front, India’s total exports reached record levels of USD 825.3 billion in FY25 and USD 418.5 billion in H1 FY26, driven by strong growth in services exports and sustained momentum in non-petroleum, non-gems, and jewellery exports.
India’s integration into global trade continues to deepen, marked by diversification and strong services-led growth. India’s share in global merchandise exports increased from 1% in 2005 to 1.8% in 2024.
According to UNCTAD’s Trade and Development Report 2025, India ranks third among countries in the Global South in terms of the diversity index of trade partnerships, following China and the UAE. India’s index score of 3.2 exceeds that of all countries in the Global North, underscoring its resilience in the face of tariff uncertainties and other emerging challenges.
Services exports emerged as a key growth engine, reaching an all-time high of USD 387.5 billion in FY25, registering a robust 13.6% year-on-year growth. This performance reinforced India’s position as a global hub for technology, business, and professional services, with rising demand across IT, financial, and knowledge-intensive segments.
External buffers remained strong. Foreign exchange reserves stood at USD 701.4 billion as of 16 January 2026, providing an import cover of around 11 months and covering over 94% of external debt, thereby strengthening India’s capacity to withstand external shocks.
India also remained the world’s largest recipient of remittances, with inflows reaching USD 135.4 billion in FY25, offering critical support to the current account. Notably, the share of remittances from advanced economies increased, reflecting the growing contribution of skilled and professional Indian workers in global labour markets.
Industrial Output: IIP and Core Sector Performance
Industrial activity gathered further momentum in December 2025, with broad-based improvement reflected across both the Index of Industrial Production (IIP) and the Index of Eight Core Industries (ICI).
The combined Index of Eight Core Industries (ICI) measures both the individual and aggregate performance of production across eight key sectors viz. coal, crude oil, natural gas, refinery products, fertilizers, steel, cement, and electricity. It serves as a leading indicator of industrial performance and accounts for 40.27% of the total weight of the IIP.
The IIP rose by 7.8% in December 2025, marking its highest level in over two years, following robust growth of 7.2% (RE) in November 2025. Sector-wise, Manufacturing remained the primary growth driver, expanding by 8.1%, while Mining and Electricity recorded growth of 6.8% and 6.3%, respectively.
Within manufacturing, strong performance was observed in technology- and mobility-linked segments, with notable growth in:
- Computer, electronic and optical products (34.9%)
- Motor vehicles, trailers and semi-trailers (33.5%)
- Other transport equipment (25.1%)
On the core sector front, Cement production surged by 13.5% year-on-year, followed by Steel at 6.9%, reflecting sustained demand from construction and infrastructure-related activities. Other core sectors also posted positive growth, including Electricity (5.3%), Fertilizers (4.1%), and Coal (3.6%), reinforcing the recovery across energy and input-intensive industries.
Overall, the synchronised improvement in IIP and ICI points to strengthening industrial fundamentals, supported by infrastructure spending, resilient domestic demand, and steady expansion across core and manufacturing sectors.
Fiscal Development
Strengthened Fiscal Credibility and Rating Upgrades
Prudent fiscal management by the government has enhanced credibility and strengthened confidence in India’s macroeconomic and fiscal framework, resulting in three sovereign credit rating upgrades in 2025 by Morningstar DBRS, S&P Global Ratings, and Rating and Investment Information (R&I), Inc.
Improvement in Centre’s Revenue Receipts
The Centre’s revenue receipts improved from an average of about 8.5% of GDP in FY16–FY20 to 9.2% of GDP in FY25 (PA), mainly supported by buoyant non-corporate tax collections that increased from about 2.4% of GDP pre-pandemic to around 3.3% post-pandemic.
Expansion of the Direct Tax Base
The share of direct taxes in total taxes rose from 51.9% pre-pandemic to 55.5% post-pandemic, reaching 58.8% in FY25 (PA). Meanwhile, the direct tax base expanded steadily, with income tax return filings rising from 6.9 crore in FY22 to 9.2 crore in FY25, indicating better compliance, wider use of technology in tax administration, and more individuals entering the tax net as incomes increased.
GST Performance and Transaction Activity
Gross GST collections during April–December 2025 amounted to ₹17.4 lakh crore, reflecting year-on-year growth of 6.7% and broadly tracking nominal GDP growth conditions. High-frequency indicators point to strong transaction activity, with cumulative e-way bill volumes during the same period increasing by 21% YoY.
Rise in Effective Capital Expenditure
The government’s effective capital expenditure increased from an average of 2.7% of GDP in the pre-pandemic period to about 3.9% post-pandemic, and further to 4% of GDP in FY25.
Support to States’ Capital Spending (SASCI)
Under the Special Assistance to States for Capital Expenditure (SASCI), the Centre has incentivised States to maintain capital spending at around 2.4% of GDP in FY25.
Trends in State Governments’ Fiscal Deficit
The combined fiscal deficit of State Governments remained broadly stable at around 2.8% of GDP in the post-pandemic period, similar to pre-pandemic levels, but rose in recent years to 3.2% in FY25, reflecting emerging pressures on State finances.
Reduction in General Government Debt Ratio
India lowered its general government debt-to-GDP ratio by about 7.1 percentage points since 2020 while continuing to maintain high levels of public investment
Building a Balanced Financial Ecosystem
India’s monetary and financial sectors have strong performance during FY26 (April-December 2025), amidst elevated uncertainty in the global financial markets. In an increasingly fragmented global financial environment, India’s regulatory framework, institutional resilience, and growing reliance on domestic financial channels have played a stabilising role. With support of strong monetary management and financial intermediation across channels, India has remained stable and safeguarded against economic shocks.
Monetary Policy Actions and Liquidity Management
In response to the evolving macroeconomic and financial developments, the Reserve Bank of India’s (RBI) Monetary Policy Committee cumulatively reduced the repo rate by 100 basis points between April to December 2025, currently at 5.25%. The reductions have been aimed to boost credit flow, investment, and overall economic activity.
Complementing policy rate cuts, the RBI reduced the cash reserve ratio (CRR) by 100 basis points to 3.0% during September-November 2025. In addition, the RBI injected durable liquidity of ₹2.39 lakh crore through open market operations during April-May 2025, followed by further OMO purchases of ₹1 lakh crore and a 3-year USD/ INR buy-sell swap of USD 5 billion in December 2025. As a result, system liquidity remained in surplus, averaging ₹1.89 lakh crore in FY26 (up to 8 January 2026), compared to ₹1,605 crore in FY25.
Monetary Aggregates and Credit Transmission
While reserve-money growth moderated to 2.9% by December 2025, compared to 4.9% as of December 2024, the CRR adjusted growth stood at 9.4% as compared to 6.2% a year ago. The trend reflects the expansionary stance of monetary policy.
During the same period, broad-money growth rose to 12.1% as compared with 9% a year ago, indicating that banks effectively leveraged the liquidity released by the CRR cut. The trend is driven primarily by rising aggregate deposits with banks, which are the largest component of broad money.
The money multiplier increased to 6.21 in December 2025 from 5.70 a year earlier, signalling improved financial intermediation by the banking system, thereby ensuring adequate systemic liquidity.
Banking Sector Performance and Credit Dynamics
The banking sector strengthened further in FY26 with Gross non-performing asset (GNPA) ratios declining to multi-decadal lows and net NPAs reaching record low levels. The capital-to-risk-weighted assets ratio (CRAR) of scheduled commercial banks (SCBs) remained strong at 17.2% as of September 2025.
Profitability also improved; Profit after tax of SCBs rose by 16.9% in FY25 and by 3.8% year-on-year as of September 2025. Return on equity stood at 12.5% while return on assets stood at 1.3% in September 2025.
Credit growth, after moderating earlier in FY26, picked up momentum. Outstanding credit by SCBs increased to 14.5% (YoY) in December 2025, compared to 11.2% in December 2024. December 2025 marked the highest YoY growth rates for both bank credit and non-food credit in FY26.
Credit growth for MSMEs continued to show momentum and remained robust, with MSME credit expanding by 21.8% in November 2025. Within this sector, micro and small enterprises recorded an increase of 24.6% (YoY) in November 2025, up from 10.2% in November 2024.
| Improving Financial Inclusion Metrics
RBI’s Financial Inclusion (FI) Index measures the country’s progress in achieving financial inclusion. It captures data on 97 indicators related to banking, investments, insurance, postal, and pension sectors across three dimensions: access, usage, and quality. These dimensions are represented through three sub-indices, viz., FI-access, FI-usage, and FI-quality. India’s Financial Inclusion Index rose from 64.2 in March 2024 to 67.0 in March 2025. |
Capital Markets and Household Financialisation
Capital markets played an increasingly prominent role in capital formation. During FY26 (up to December 2025), total resource mobilisation from primary markets stood at ₹10.7 lakh crore. Over the past five years, from FY22 to FY 26 (till December 2025), primary markets mobilised a total of ₹53 lakh crore through equity and debt issuances.
Household financial savings continued to shift towards market-linked instruments. Individual investors’ share in equity ownership increased to 18.8% by September 2025, with household equity wealth increasing by about ₹53 lakh crore between April 2020 and September 2025. The share of equity and mutual funds in annual household financial savings rose from around 2% in FY12 to over 15.2% in FY25.
Conclusion
The macroeconomic trends in FY26 point to an economy characterised by stability alongside momentum. Growth remains broad-based across agriculture, industry, and services, while inflation has moderated and labour market indicators have strengthened. External sector performance, rising services exports, and comfortable foreign exchange reserves provide resilience against global shocks. Fiscal consolidation has advanced in parallel with sustained capital expenditure, and the financial system remains well-capitalised and supportive of credit expansion and financial inclusion.
Together, these developments indicate strengthening economic fundamentals and an improved capacity to sustain growth while maintaining macroeconomic stability.