
Binary super massive black hole discovered in a system which could be site of future gravitational waves detection
An international collaboration of astronomers has discovered a binary supermassive black hole in a system that will be a strong candidate for future detection of gravitational waves (GWs).
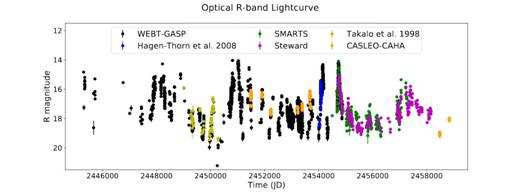
Figure 1. Optical R -band light curve of AO 0235+164 measured between JD 2445300 (1982 November 26) and JD 2458835 (2019 December 17).
Blazars which are super massive black holes (SMBH) feeding on gas in the heart of a very distant galaxy, are among the most luminous and energetic objects in the Universe. When the jet, composed of ionized matter traveling at nearly the speed of light, is pointed towards an observer, it is called a blazar. The blazar AO 0235+164 is unique as it is gravitationally lensed by intervening galaxies (phenomenon by which light shining from far away to be bent and pulled by the gravity of an object between its source and the observer).
A group of astronomers from Argentina, Spain, Italy, USA and India has discovered a binary super massive black hole system in the gravitationally lensed blazar AO 0235+164 using extensive optical photometric observations carried out around the globe during last 4 decades (1982 – 2019). They discovered periodic double-peaked flaring events at an interval of around 8 years, and the separations between two peaks of these flares are around 2 years. Five such periodic patterns were detected, and it was predicted that the next such flaring event will occur between November 2022 and May 2025. To confirm the next periodic pattern, a global optical photometric monitoring campaign has been initiated under WEBT (Whole Earth Blazar Telescope) consortium. The observational campaign will be led by Dr. Alok C. Gupta.
Dr. Alok C. Gupta, Senior Scientist from Aryabhatta Research Institute of Observational Sciences (ARIES), Nainital, an autonomous institution of the Department of Science and Technology (DST), Government of India, has participated in this study which has been recently published in the journal Monthly Notices of the Royal Astronomical Society (MNRAS). The study was led by Mr. Abhradeep Roy, a Ph.D. student of the Department of High Energy Physics (DHEP), Tata Institute of Fundamental Research (TIFR), Mumbai. The other members of the Indian team include Prof. V. R. Chitnis, Dr. Anshu Chatterjee and Dr. Arkadipta Sarkar from TIFR, Mumbai.
The team detected five sets of double-peaked flaring activities during time ranges — January 1982 – October 1984, March 1989 – July 1993, April 1996 – March 2001, June 2006 – June 2009 and May 2014 – May 2017.
They expect the next such 2 years long flaring episode to happen between November 2022 and May 2025. An intensive multi-wavelength WEBT campaign will be conducted during this period to test the persistence of this apparent nearly-periodic oscillation (QPO) in AO 0235+164.
The blazar AO 0235+164 is the first binary SMBH gravitationally lensed system, which will be a strong candidate of its kind for future detection of gravitational waves (GWs) using the pulsar timing array and future space-based GW detectors.
Publication link: https://academic.oup.com/mnras/article/513/4/5238/6583302
For more details, Dr. Alok Chandra Gupta (Scientist-F) (+91-7895966668, alok[at]aries.res.in ) can be contacted.
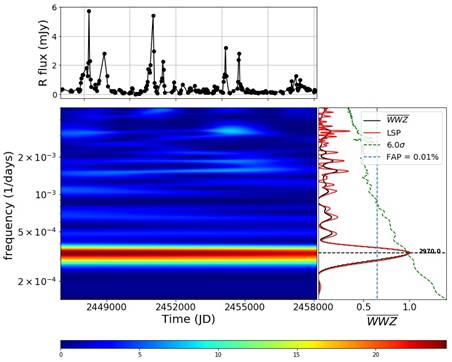
Figure 2: QPO analysis of the AO 0235 + 164 optical R-band long-term 30-d binned light curve — (a) On the upper left sub-panel, the 30-d binned R -band light curve (JD 2446994–2458124) is shown with magnitudes converted to flux densities. The lower left sub-panel displays the WWZ map, and the lower right sub-panel contains the time-averaged WWZ power (black line) on top of the normalized GLSP (red line). The dominant peak at 2970 d in the time-averaged WWZ plot crosses the GLSP 0.01 per cent FAP line (light blue dashed line). The green dashed line represents the 6 σ significance against the bending power-law red-noise spectrum obtained by simulating 2000 light curves. The red band on the WWZ map indicates a strong, ∼2970-d (8.13 yr) periodicity. (b) Power spectrum of the full R -band light curve using REDFIT. The black line represents the power spectrum, the red line is the theoretical AR1 spectrum, and the yellow, green, and blue dashed lines represent the FAP levels of 10, 5, and 1 percent, respectively. A strong periodicity of ∼2970 d crosses the 1 percent FAP level.